Traders use technical analysis to study charts or past data to forecast future market levels. Some of the most successful traders use a combination of technical and fundamental analysis, and a beginner’s guide to Forex for beginners should cover basic technical analysis patterns.
But all traders know these three basic classic technical analysis patterns:
- Head and shoulders
- Double and triple tops and bottoms
- Bullish and bearish flags
Head and Shoulders
The head and shoulders pattern is, perhaps, the pattern that every technical trader is aware of. This is a reason why many such patterns fail when forming on large timeframes.
Because traders are aware of its formation, the pattern might fail in the end. Also, it is time-consuming, allowing everyone to interpret it and even get out of a bad position if on the wrong side of the market.
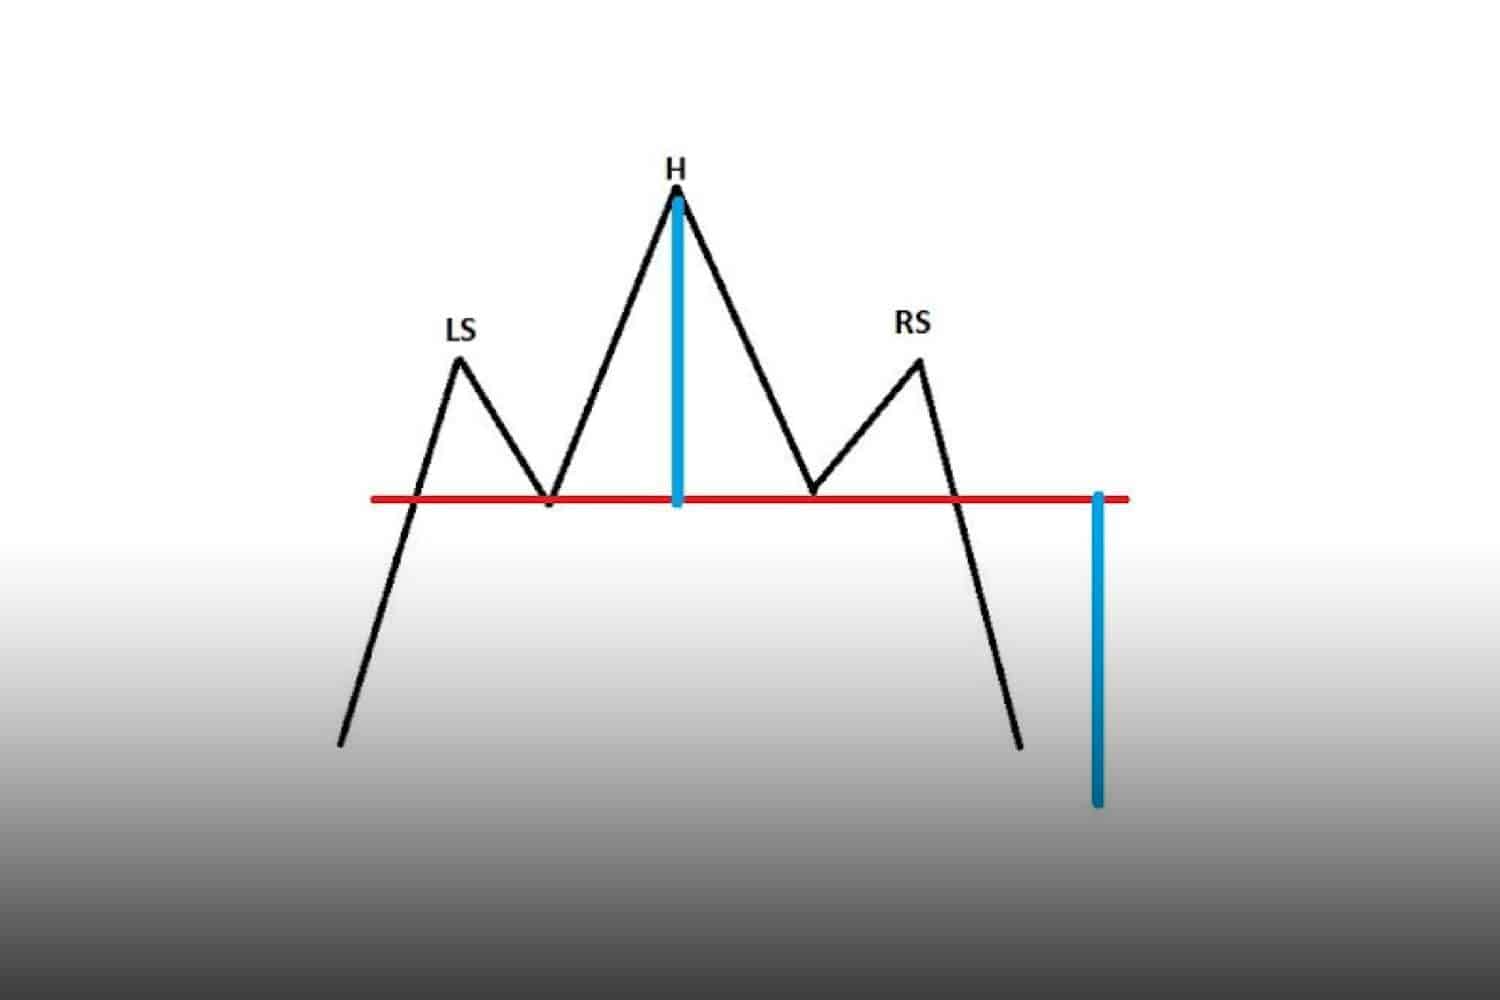
The head and shoulders are a bearish reversal pattern. It appears at the end of bullish trends and has two shoulders (left and right), one head (the highest level in the pattern), a neckline (in red below), and a measured move (seen in blue below).

The two shoulders typically resemble one another, but that is not mandatory. What is mandatory is for the price to reach the measured move for the reversal pattern’s confirmation.
As a strategy, traders typically sell short a breakout below the neckline, place a stop-loss order at the highest point in the right shoulder, and target the measured move projected from the neckline to the downside.
Double Tops and Bottoms
Double tops and bottoms are also reversal patterns. The former appears at the end of bullish trends, and the latter at bearish ones.
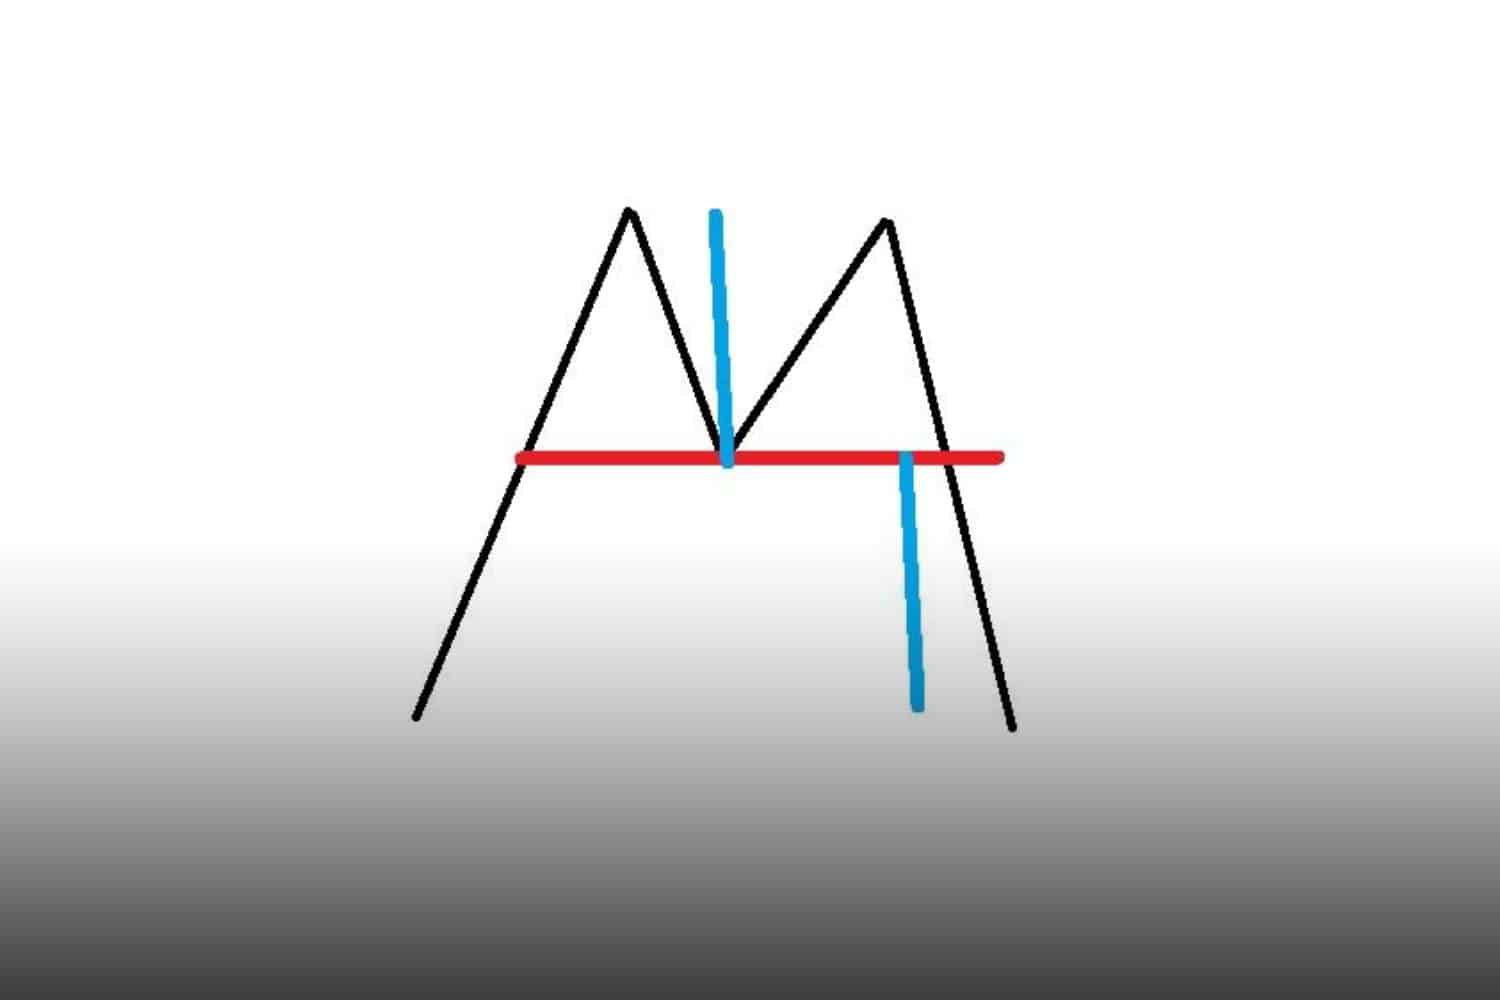
The patterns resemble the letters M, respectively W.
A double top shows two market attempts at an area with horizontal resistance. The level is not mandatory to be identical – just an area where the market has difficulty breaking above.
The neckline and measured move are shown below in red, respectively blue. As a strategy, traders wait for the market to break below the neckline before establishing a short position. The proper level for the stop-loss order is the highest point in the pattern, and the minimum target is the measured move projection from the neckline. Ideally, by trailing the stop, a risk-reward ratio bigger than 1:2 can be reached.

Bullish and Bearish Flags
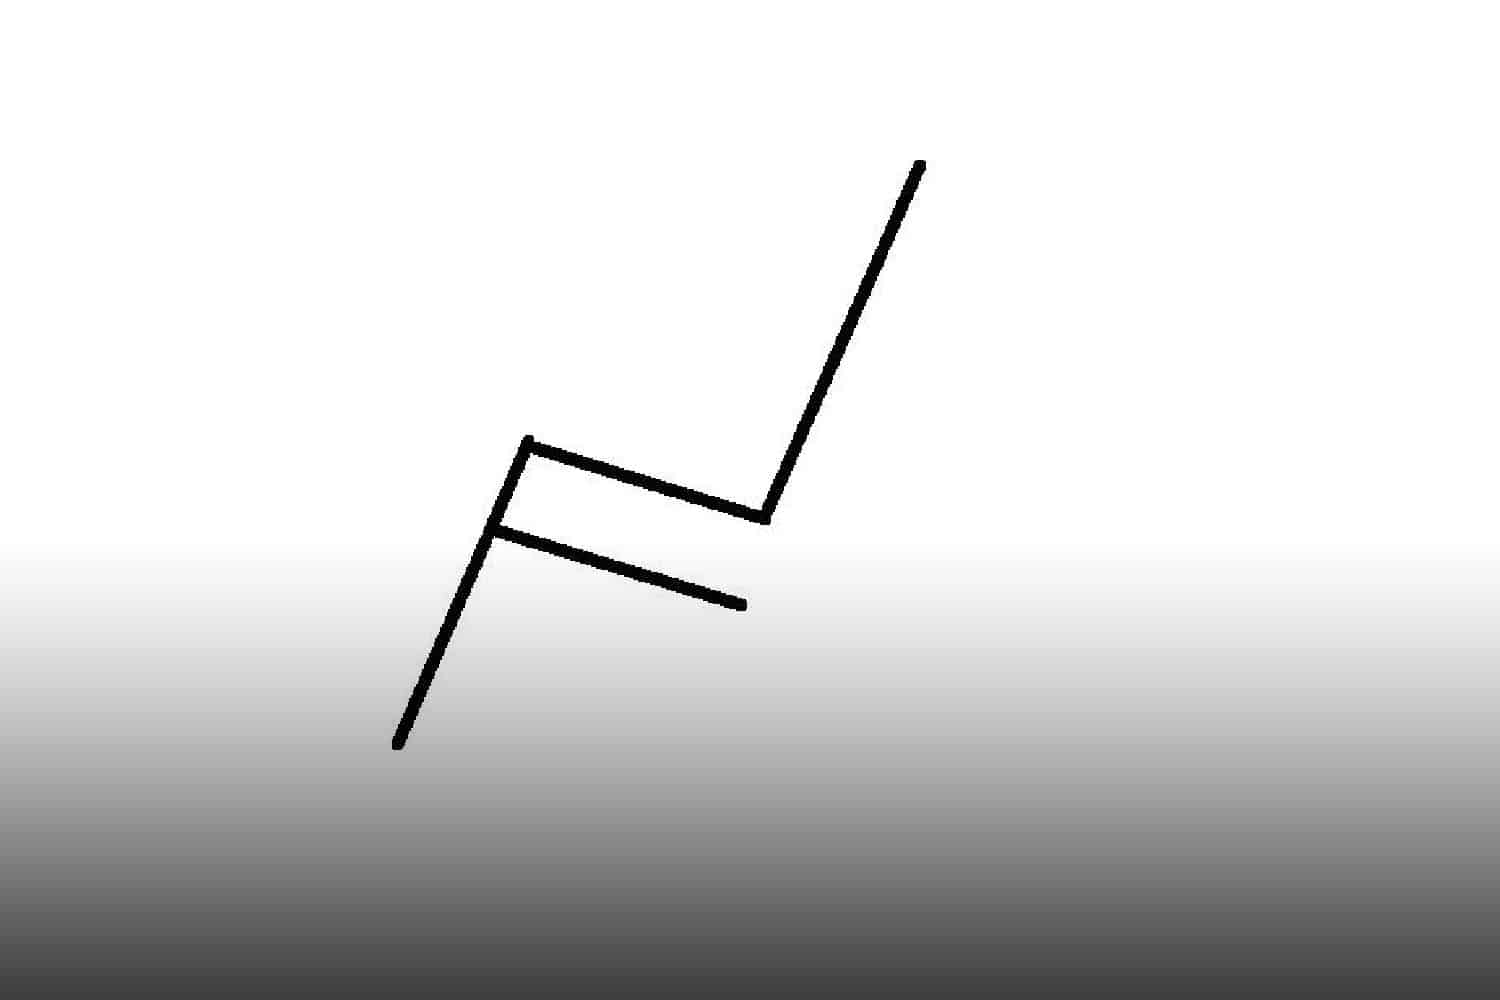
Flags are consolidation areas that form horizontally or in the opposite direction of the main market trend. They can be bullish or bearish and signal a continuation of the main trend.

As shown above, a bullish flag is followed by an aggressive move higher. It is required for the market to travel a distance similar to the one traveled before the flag’s formation for the continuation pattern to be confirmed.


