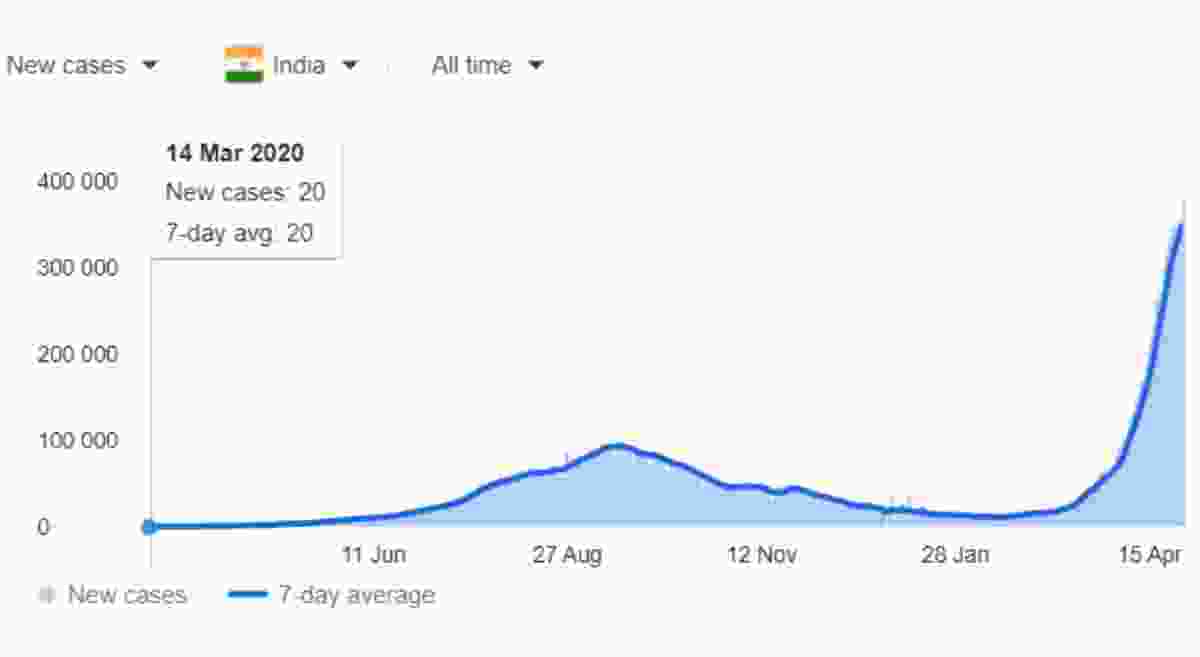
Below is a data chart pulled by the Center for Systems Science and Engineering (CSSE) at Johns Hopkins University that displays the Covid-19 trends in India over the past 10 months.
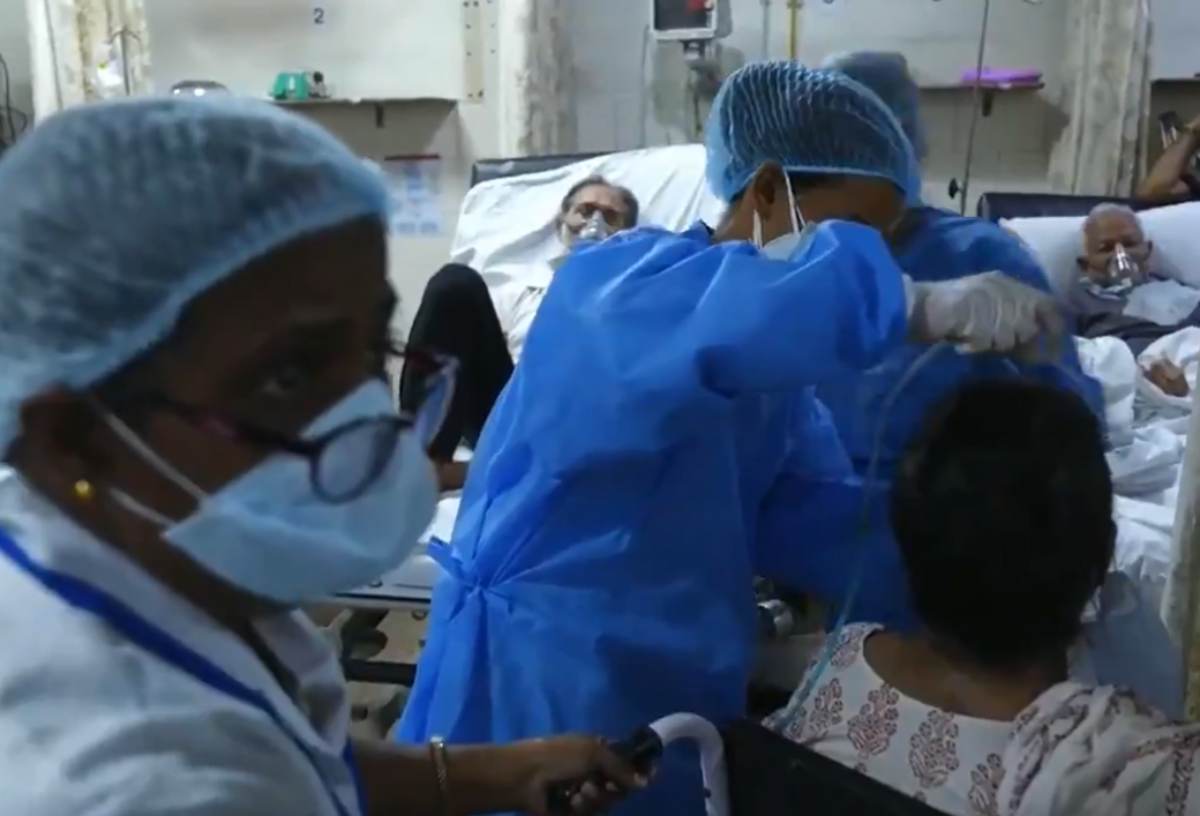
Watch: Inside a hospital ward in India
The first cases of the deadly respiratory virus were detected as early as March 2020 in the South Asian country. The spread of the virus had been largely contained with the curve rising to a seven-day average of more than 92 000 infections by September 2020.
A number of strict restrictions enforced by a no-nonsense approach from the country’s police saw India move towards flattening the curve by late January of this year.
However, for reasons that are still subject to review by the country’s elite scientists, a resilient Covid-19 strain (unverified at this stage) has sent a plaguing shockwave across the billion-plus populated republic.
Latest statistics from the CSSE-JHU chart data indicate that in its second wave, Covid-19 infections have risen to a starting weekly average of 349 378 positive tests per day.
India’s recovery rate remains on the high end, with more than 15.1 million patients discharged from hospitalisation since the start of the pandemic, out of a total of more than 18.4 million infections.
However, three million patients still require ventilation, advanced oxygen support and priority attention at ICUs and despite healthcare workers’ best efforts, the strain is too much to bear.
This BBC docu footage, taken inside one of India’s incapacitated hospital wards, shows the true horrors faced by doctors and nurses in the South Asian country.
For the first time, viewers have an opportunity to see beyond the veil and truly comprehend the threat level posed by this unseen enemy.
This is unbearable. pic.twitter.com/5uqXKiPeEd
— Barry Malone (@malonebarry) April 28, 2021